
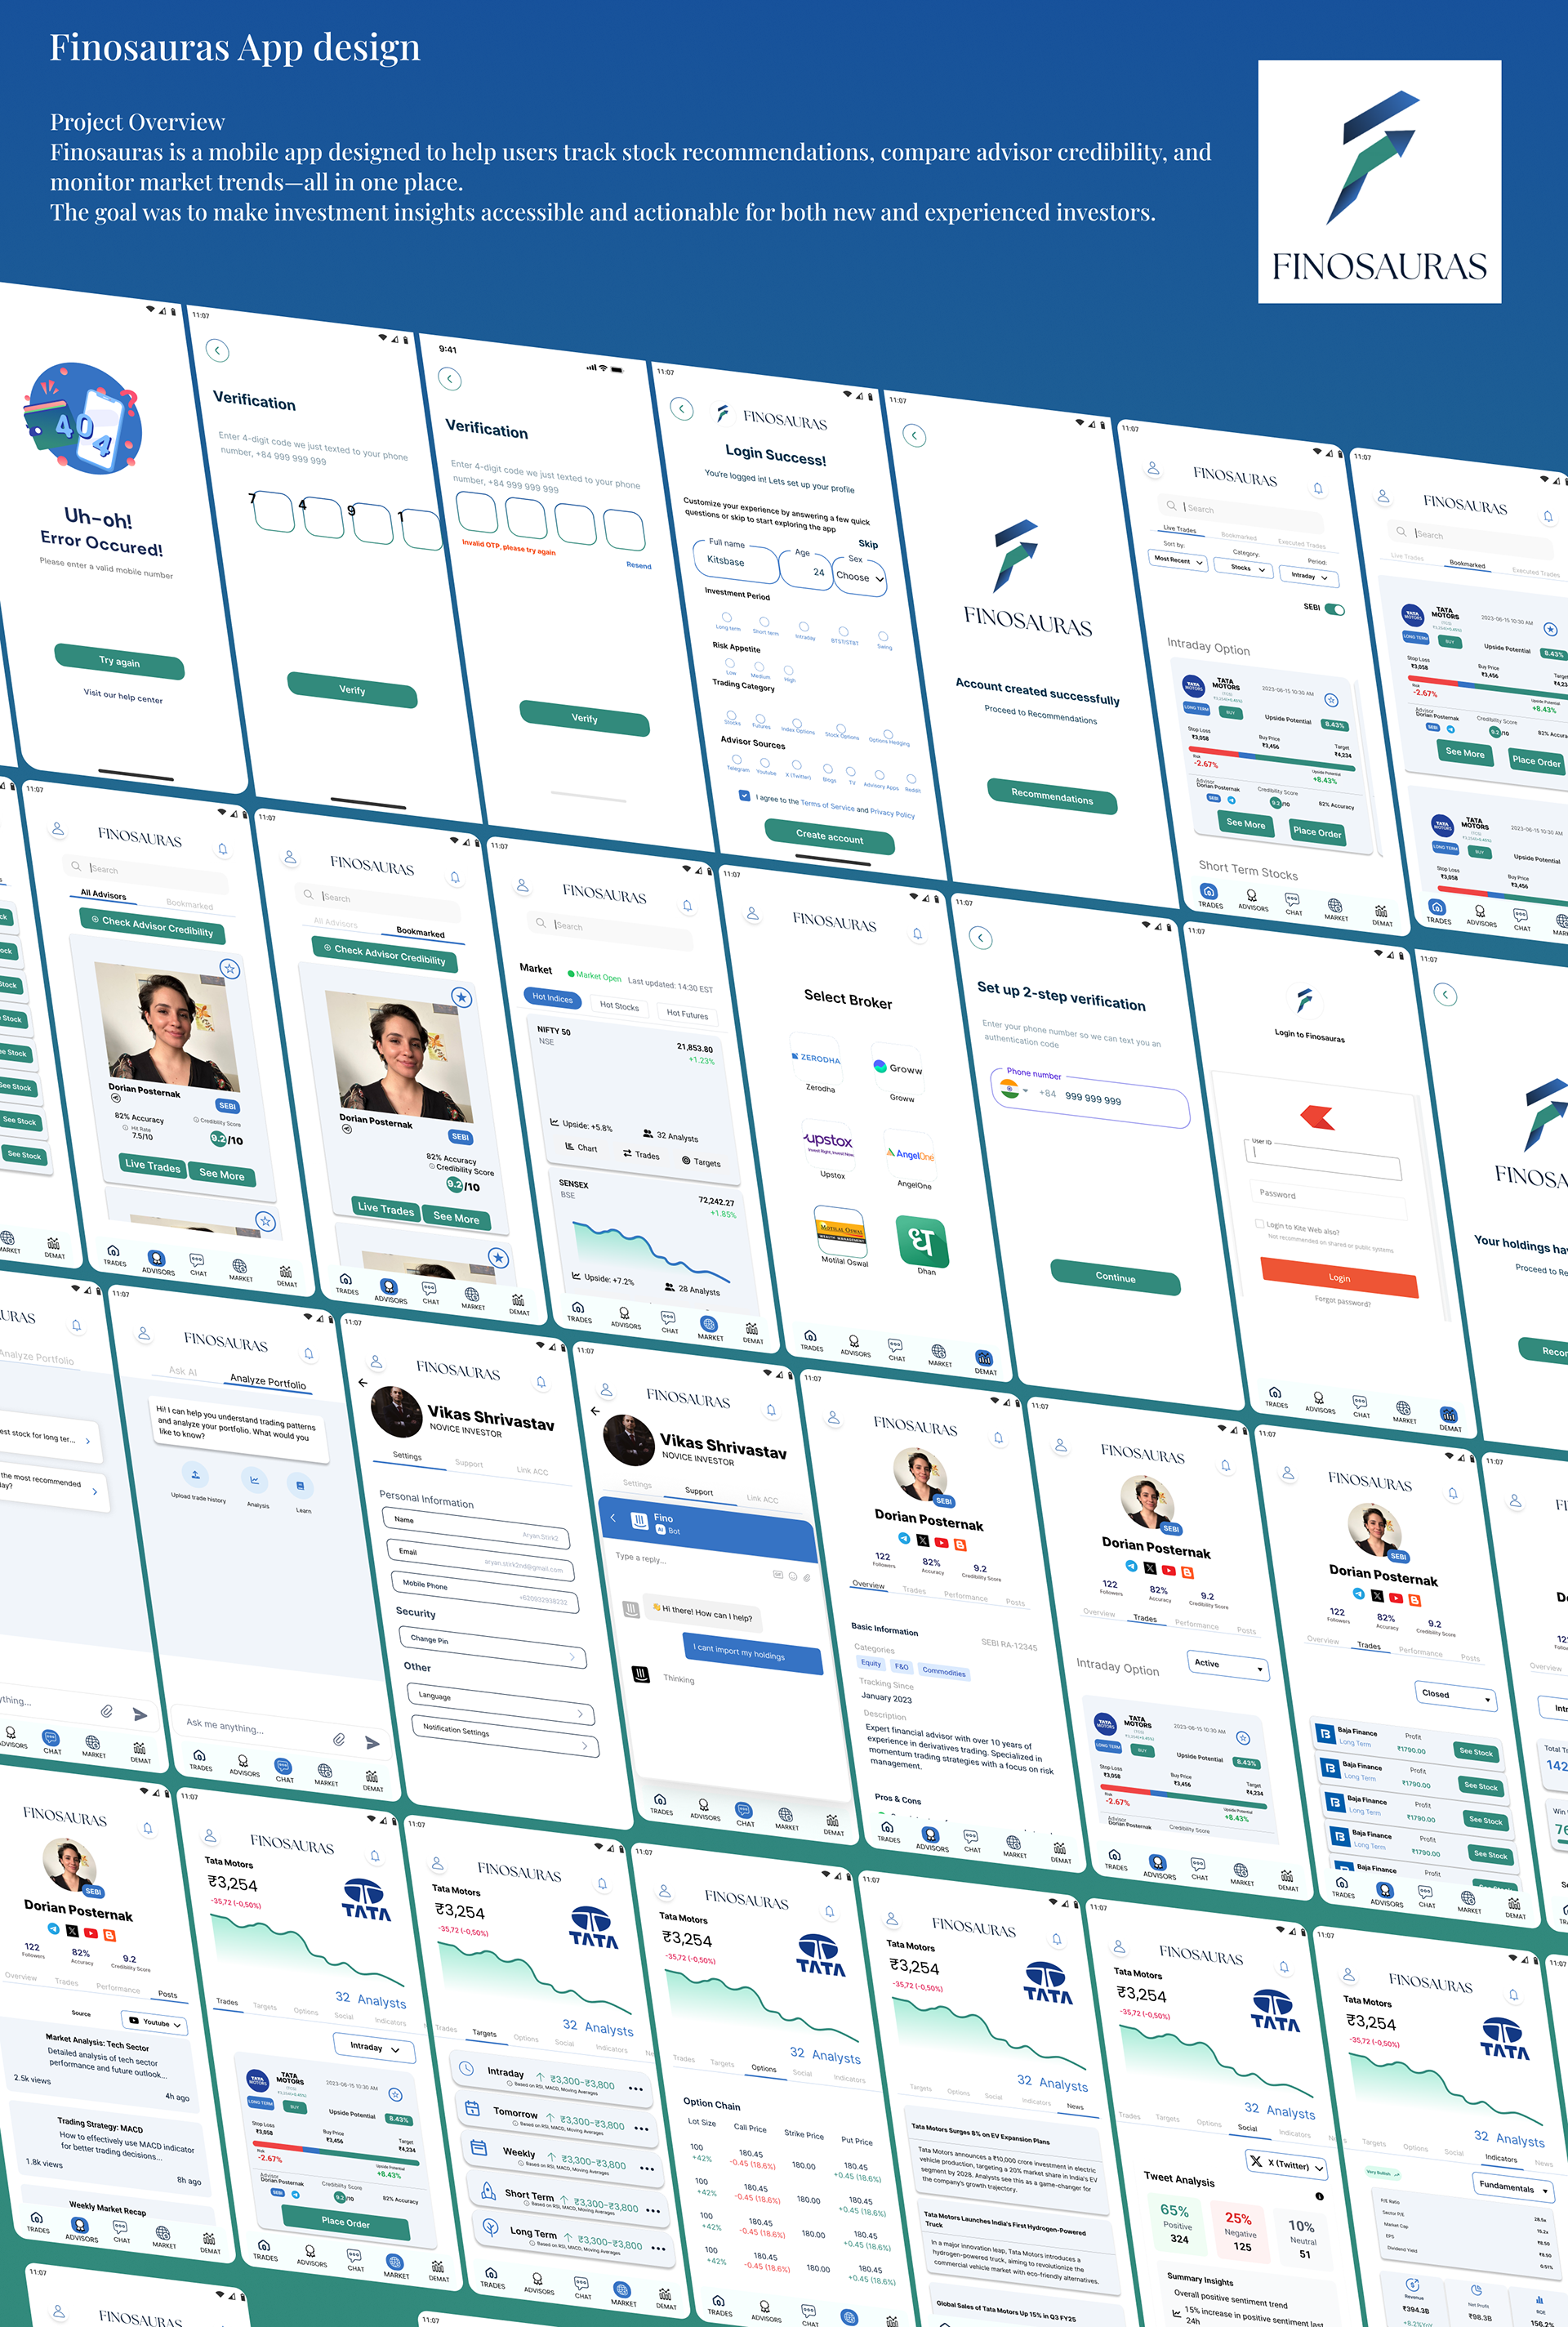
Project Overview
Finosauras is a mobile app designed to help users track stock recommendations, compare advisor credibility, and monitor market trends—all in one place. The goal was to make investment insights accessible and actionable for both new and experienced investors.
My Role
- Lead Product Designer (UI/UX)
- Responsible for end-to-end design: research, wireframes, high-fidelity UI, prototyping, and user testing
- Collaborated closely with developers, business stakeholders, and data analysts

Logo Design
The Challenge
Investors often struggle to find reliable stock advice and to track the credibility of various market advisors. Many existing platforms are cluttered, lack transparency, or are difficult for beginners to navigate.
Key problems to solve:
Make advisor credibility transparent and easy to compare
Simplify onboarding and trade tracking
Present complex data (like sentiment analysis) in a clear, actionable way
Process
1. Research & Discovery
Conducted interviews with 10+ retail investors to understand their pain points
Analyzed competitor apps to identify gaps in user experience and data presentation
Created personas representing both beginner and advanced investors
2. Ideation & Wireframing
Sketched low-fidelity wireframes for key flows: onboarding, advisor discovery, trade recommendations, and market analysis
Prioritized a clean, minimal interface to avoid overwhelming users
3. Design & Prototyping
Developed high-fidelity mockups in Figma
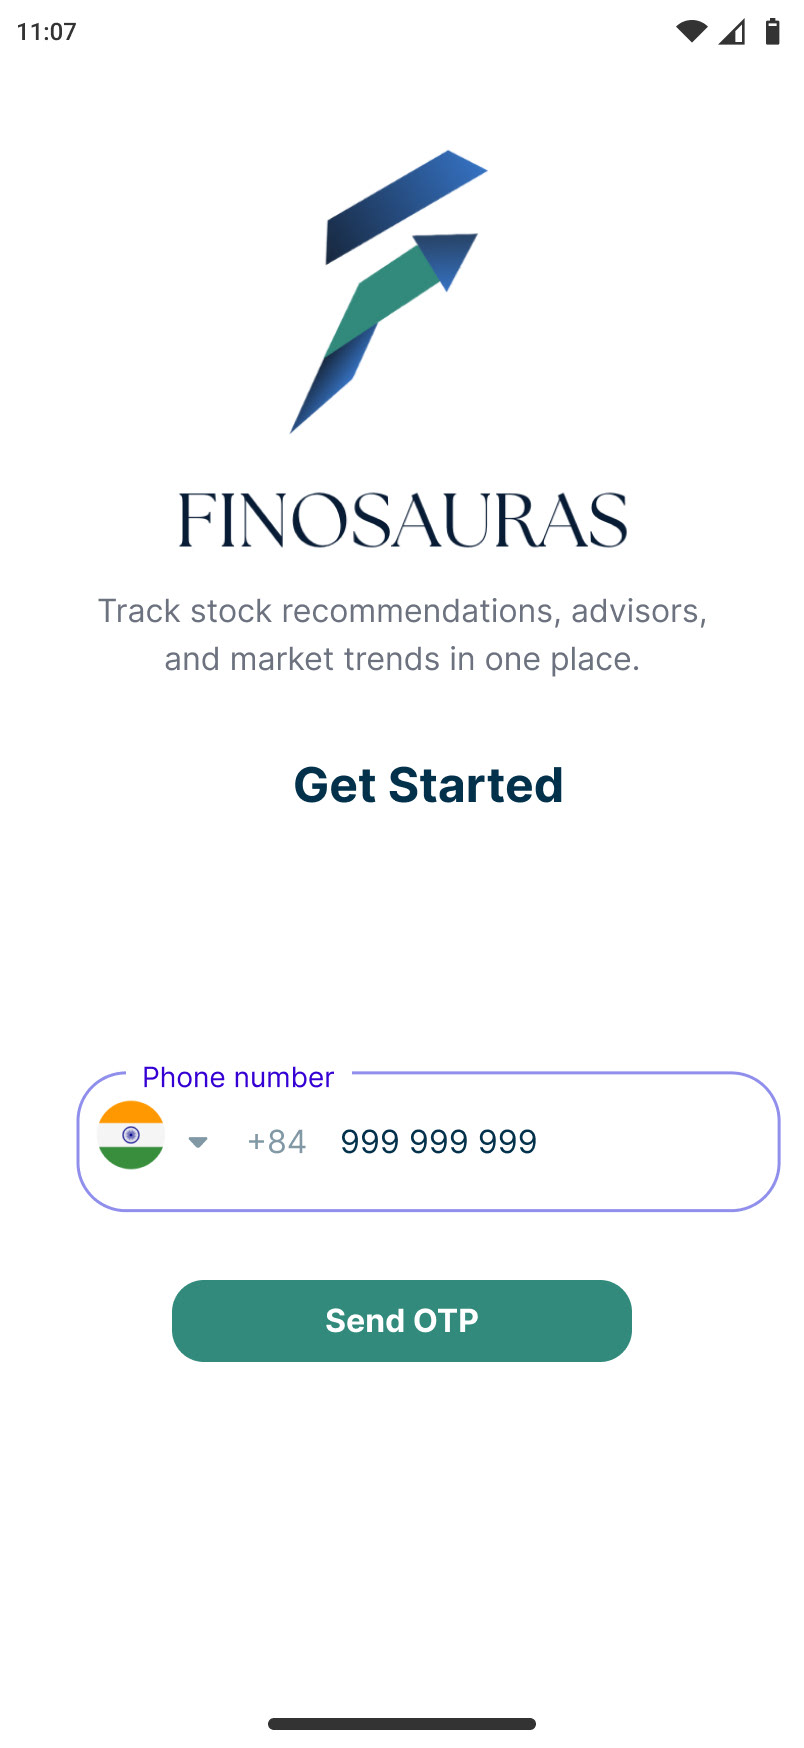
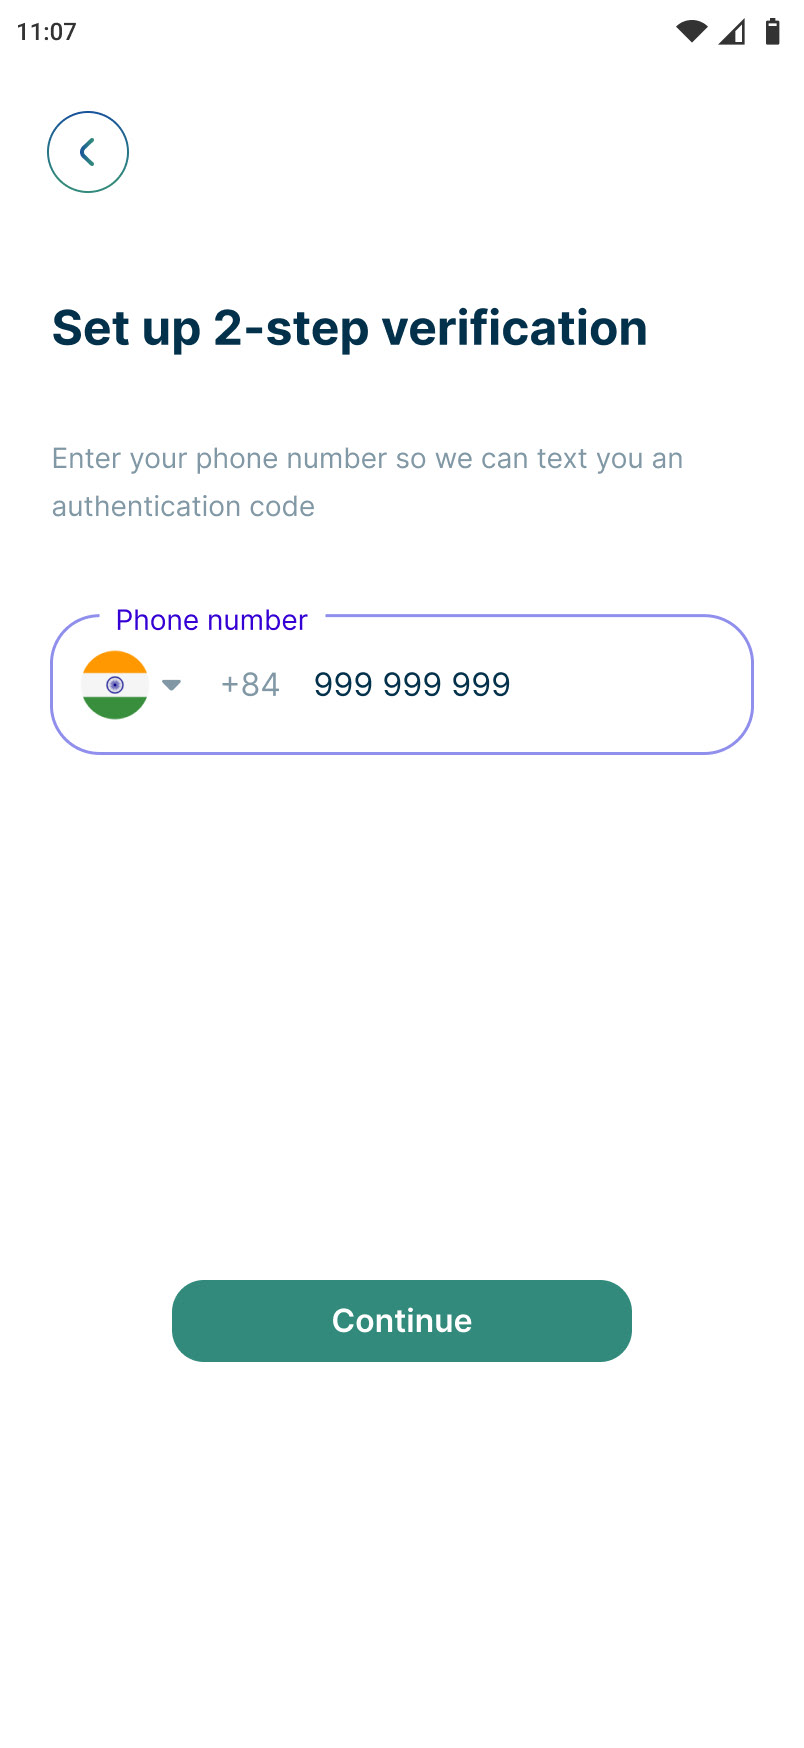
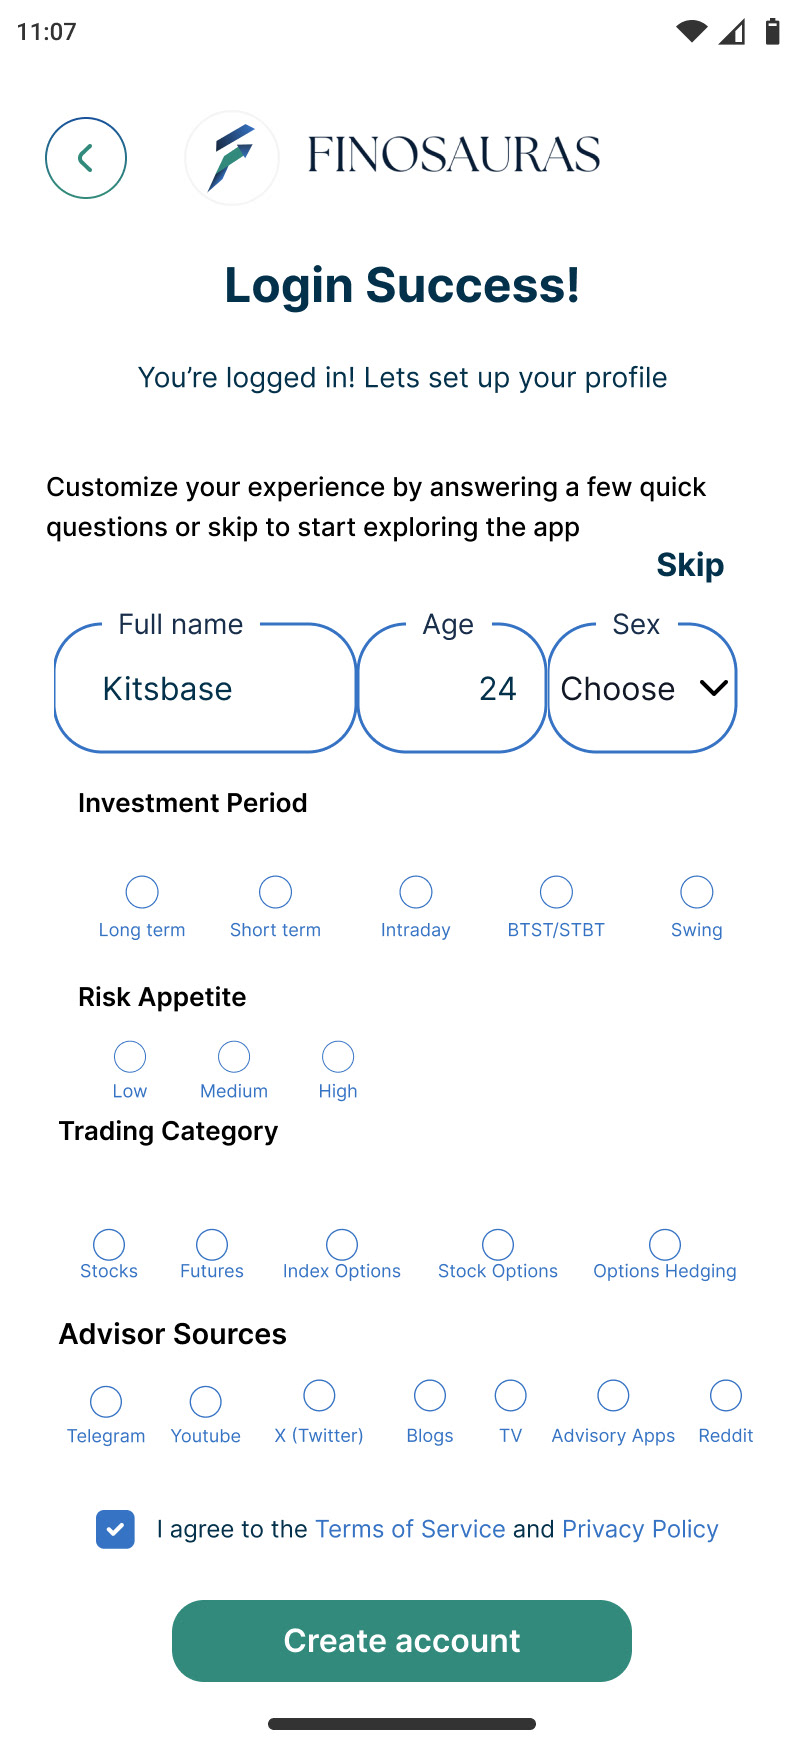
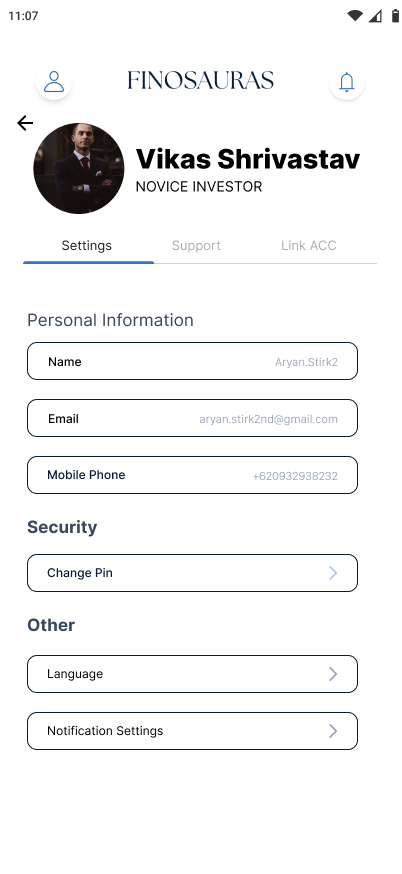
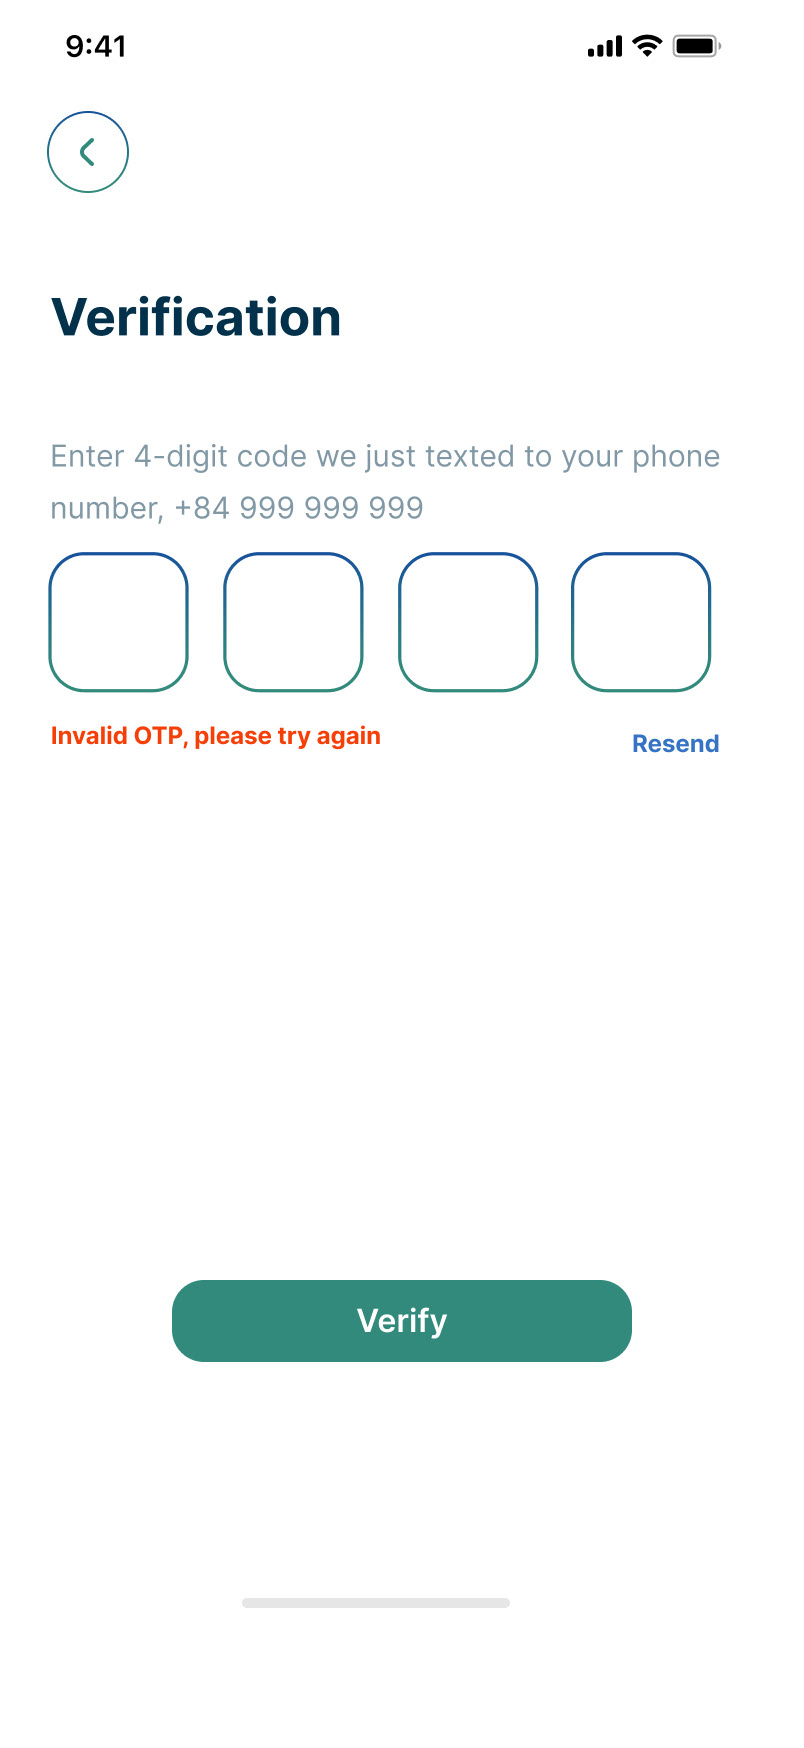
Designed a simple onboarding flow (see screenshot 1) to reduce drop-off
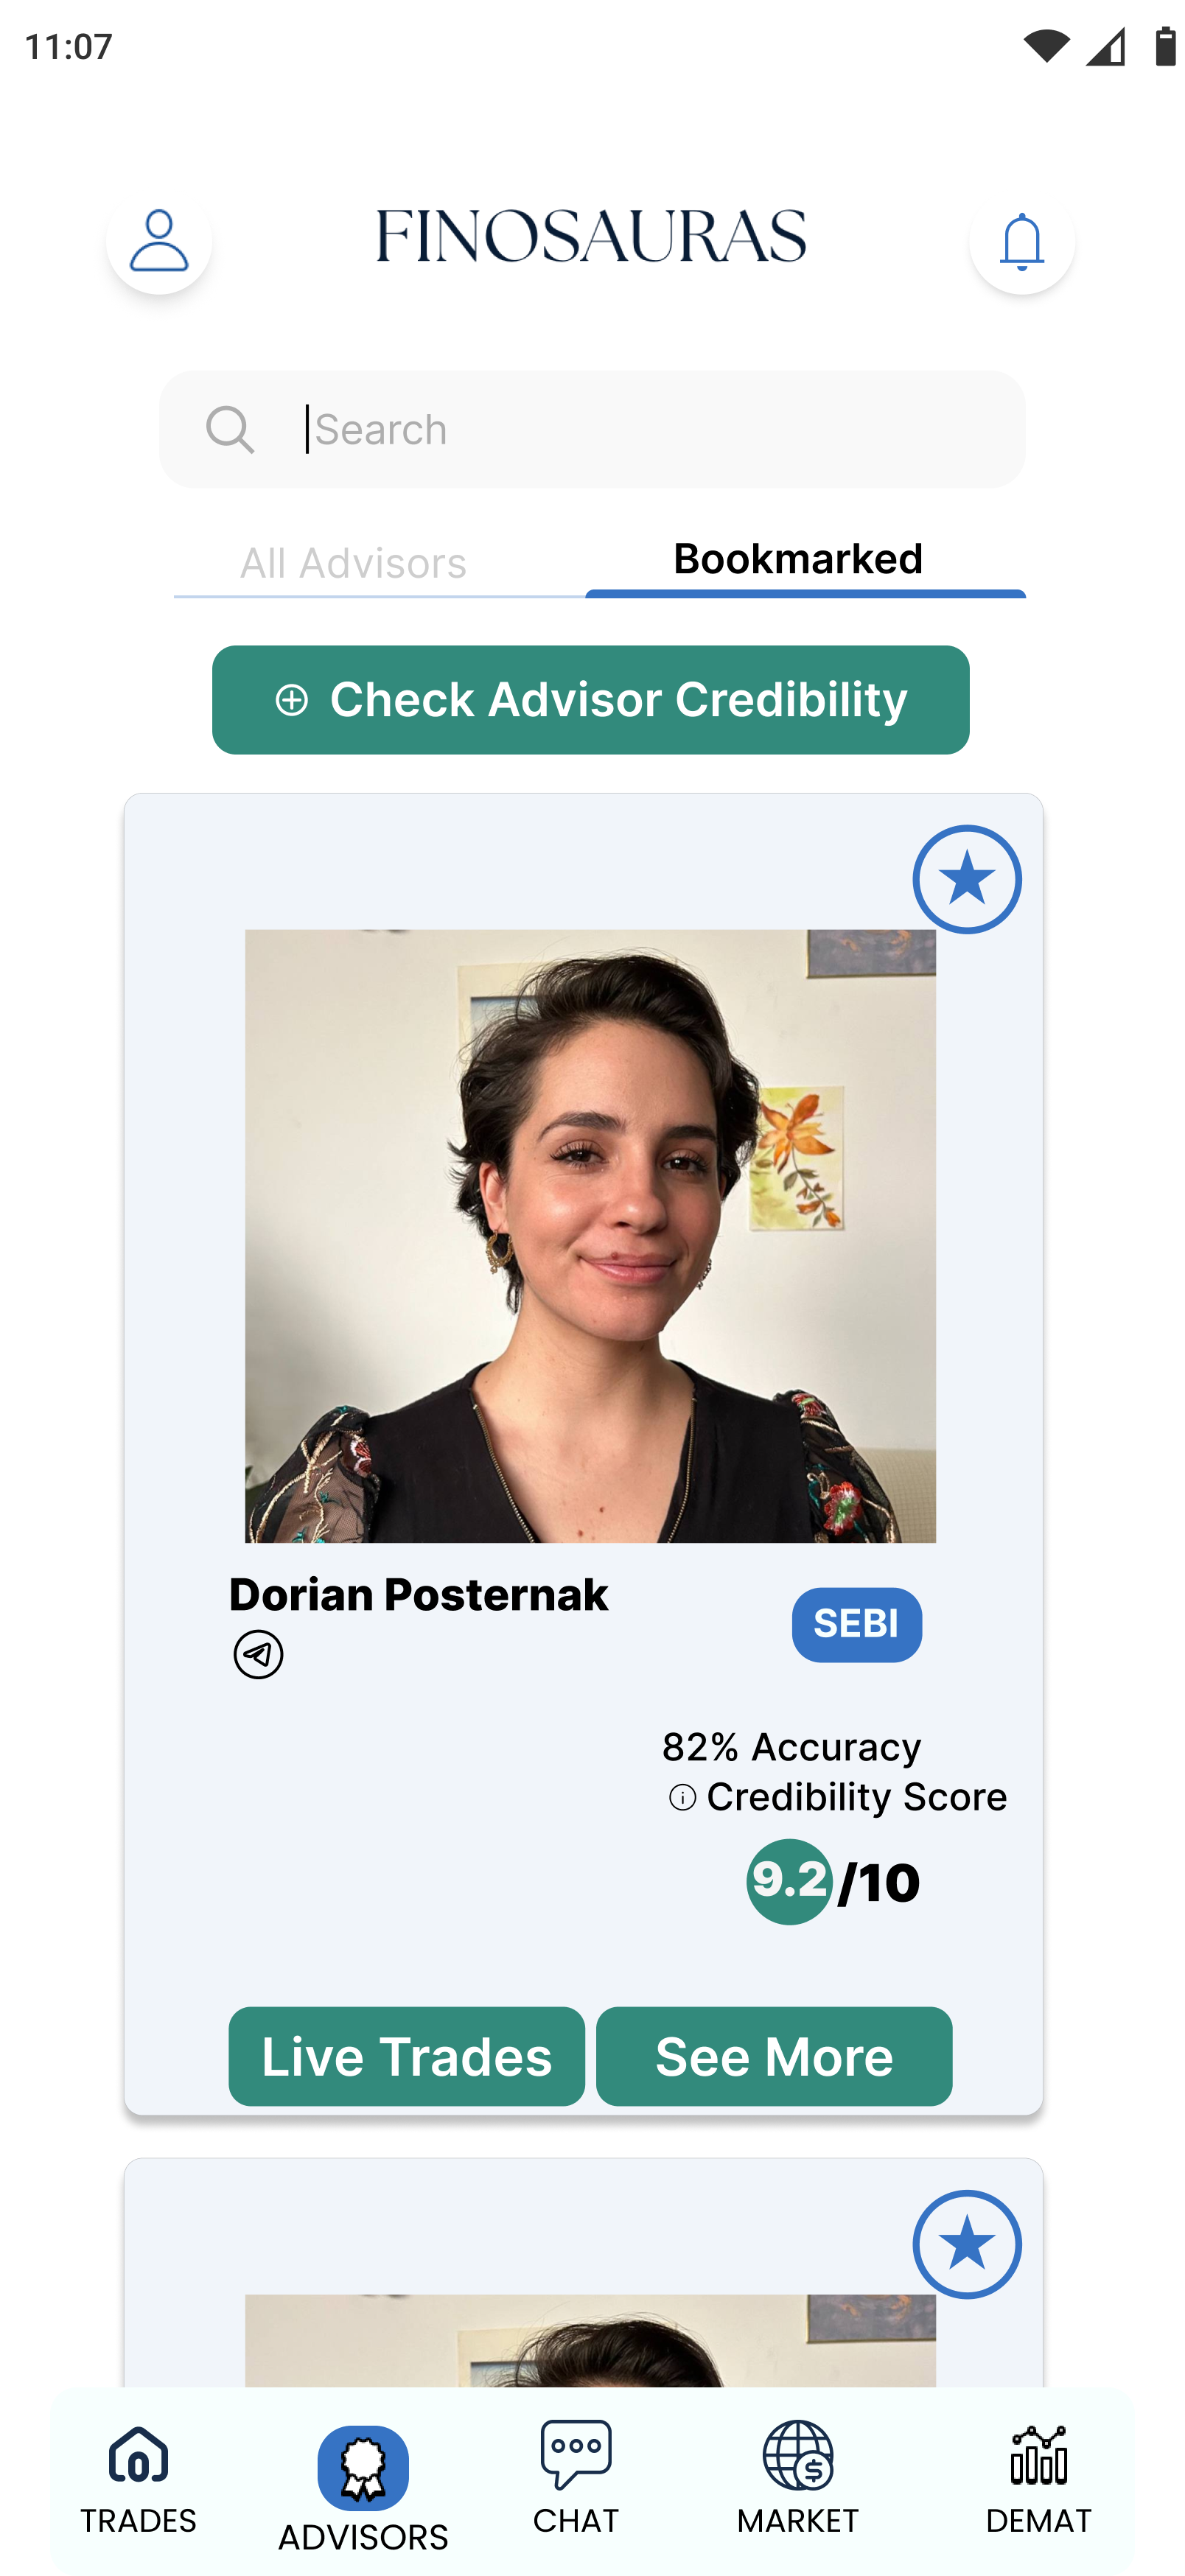
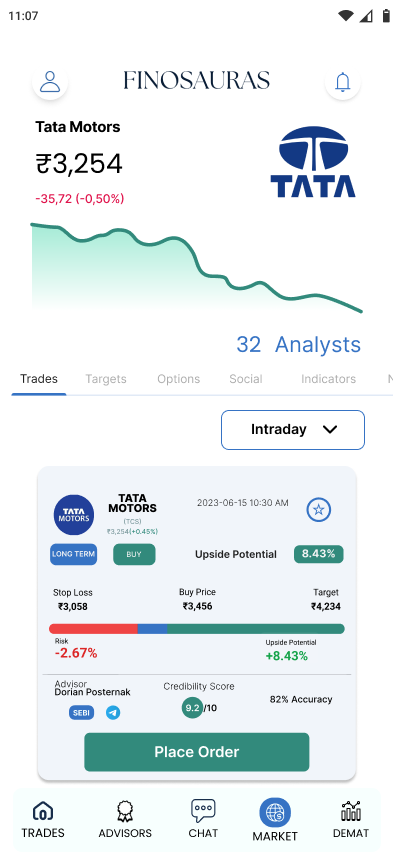
Built advisor cards with clear credibility scores, accuracy, and quick actions (see screenshot 2)
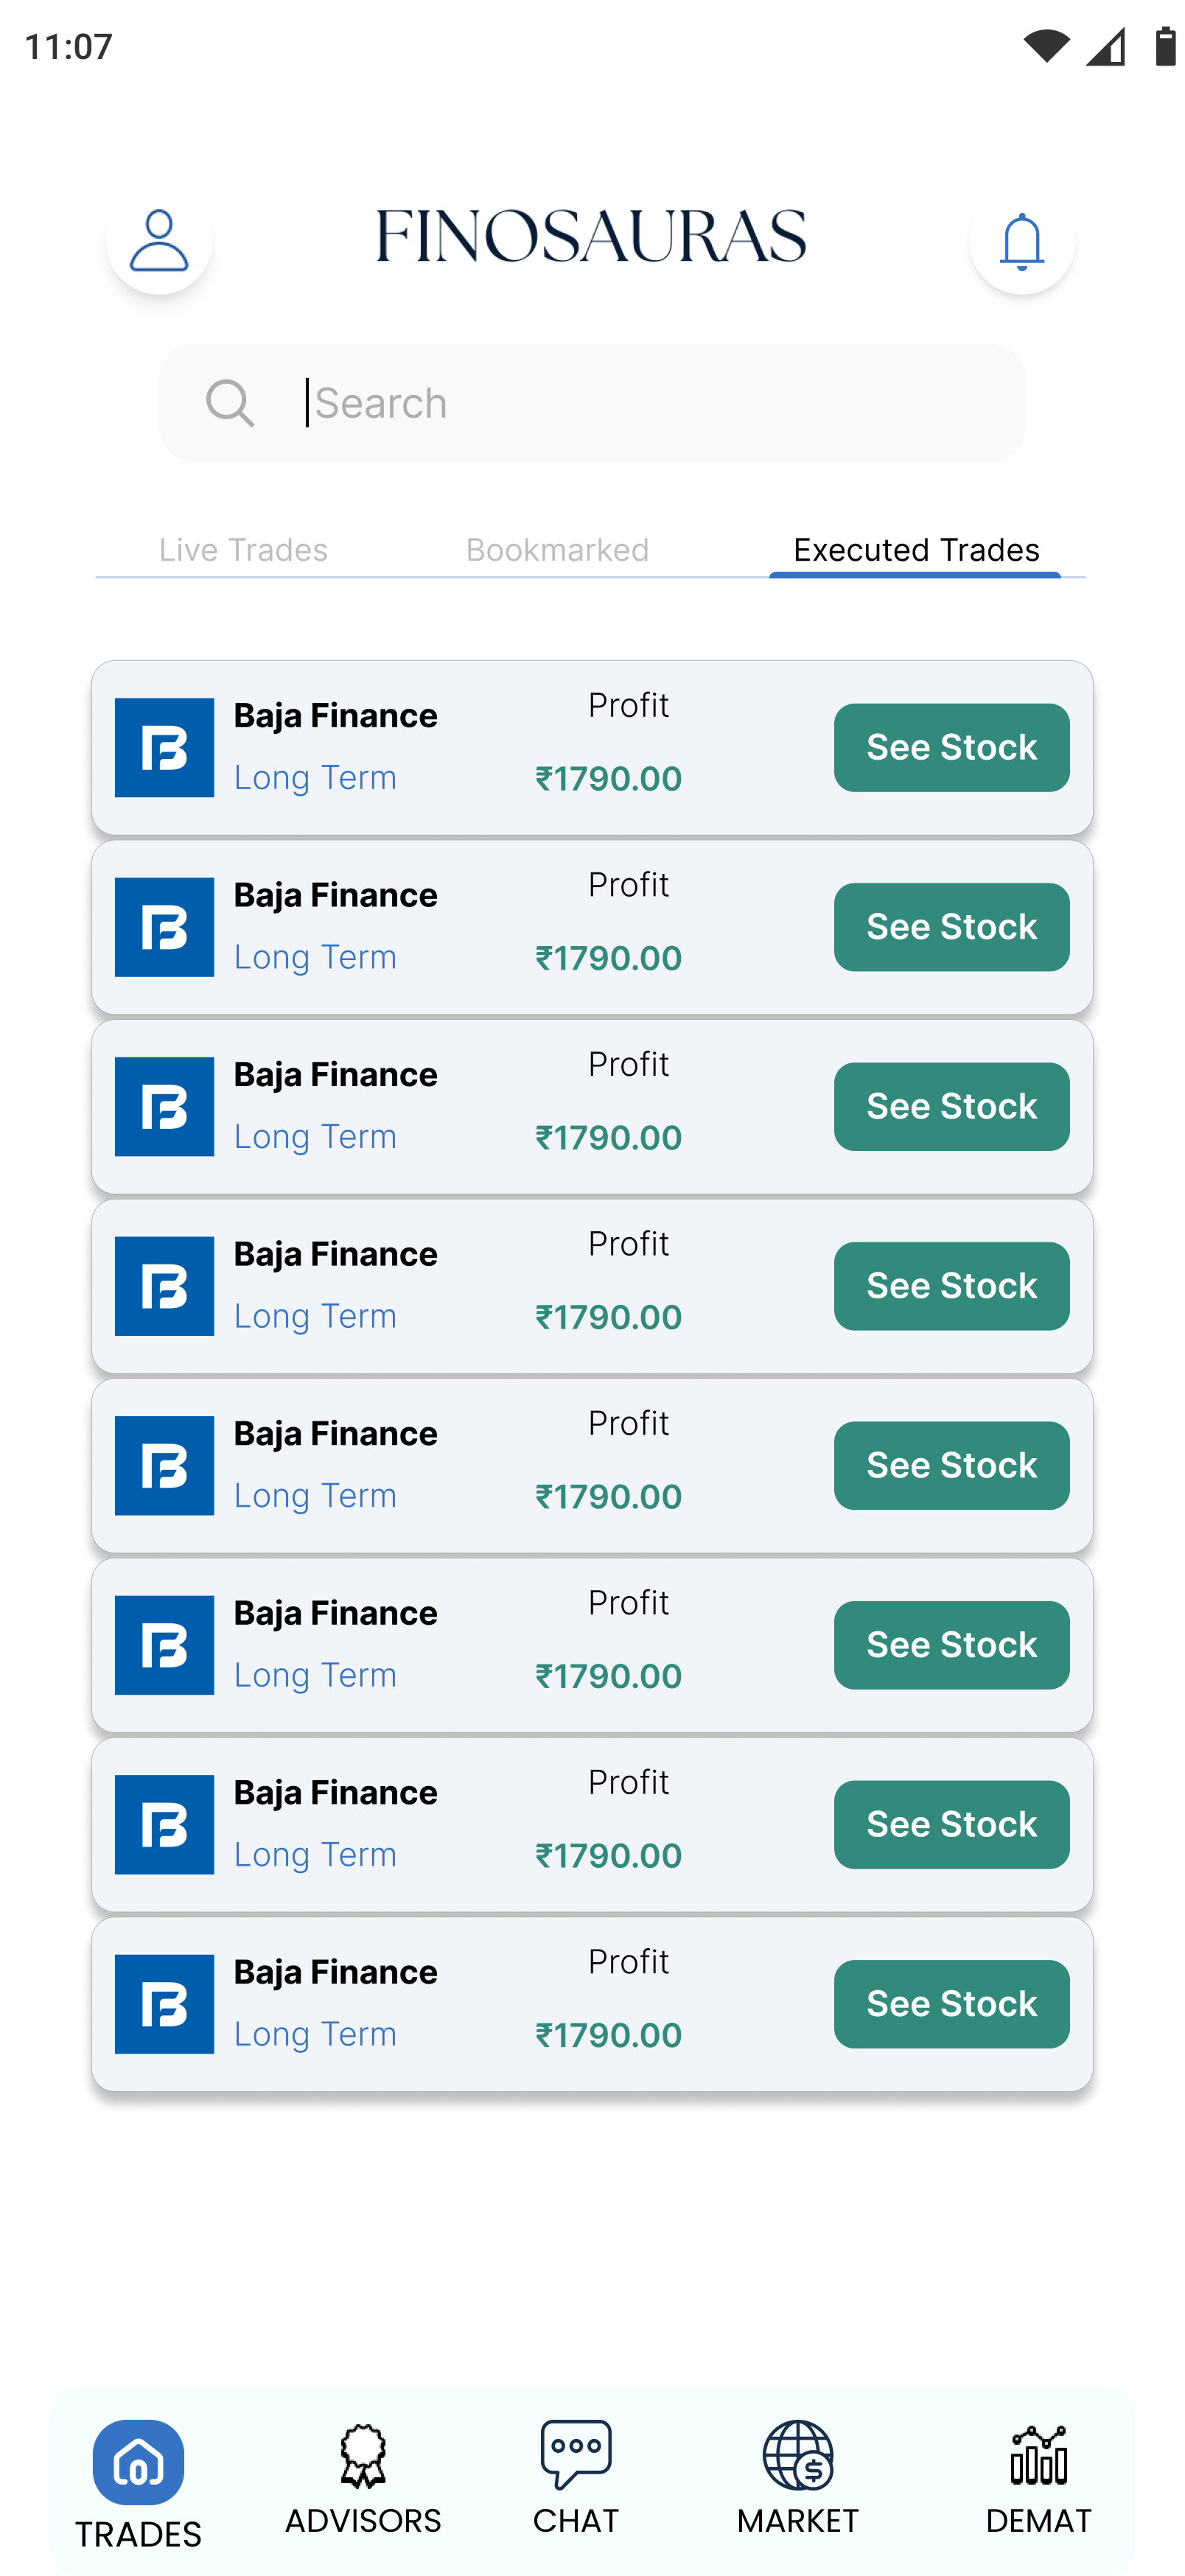
Created trade recommendation cards with risk/reward breakdowns and easy bookmarking (see screenshot 3)
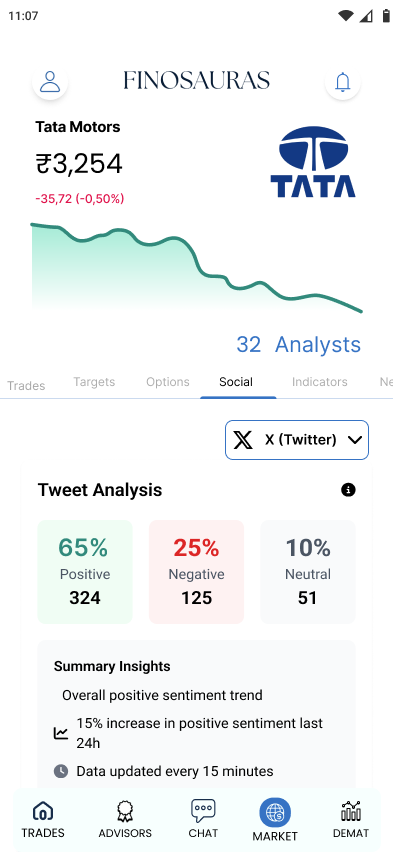
Visualized market sentiment using color-coded tweet analysis and summary insights (see screenshot 4)
4. User Testing & Iteration
Ran usability tests with 8 users (mix of beginners and experienced investors)
Iterated on navigation and data visualization based on feedback (e.g., clarified risk metrics, improved button labeling)
Added features like bookmarking, live trades, and chat based on user request


Outcome & Impact
User satisfaction: 90% of test users found the app easier to use than their current tools
Advisor transparency: Users reported increased trust in recommendations thanks to clear credibility scores
Engagement: Early testers bookmarked an average of 5+ trades per week
What I Learned
Simplicity is key when dealing with complex financial data
Visual credibility and transparency build user trust
Iterative testing with real users uncovers usability issues you can’t predict on paper
Tools Used:
Figma, Miro, Google Forms, Maze (for testing)